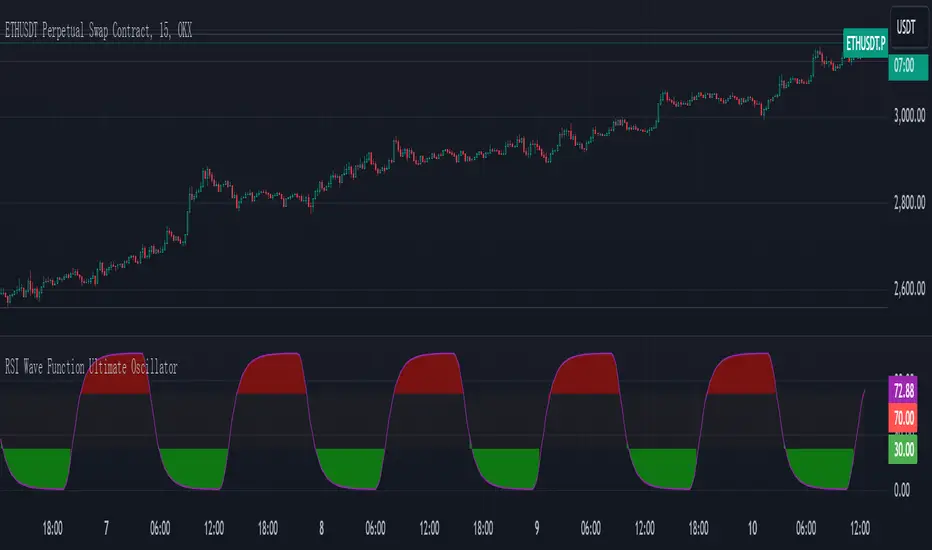
RSI Wave Function Ultimate OscillatorEnglish Explanation of the "RSI Wave Function Ultimate Oscillator" Pine Script Code
Understanding the Code
Purpose:
This Pine Script code creates a custom indicator that combines the Relative Strength Index (RSI) with a wave function to potentially provide more nuanced insights into market dynamics.
Key Components:
* Wave Function: This is a custom calculation that introduces a sinusoidal wave component to the price data. The frequency parameter controls the speed of the oscillation, and the decay factor determines how quickly the influence of past prices diminishes.
* Smoothed Signal: The wave function is applied to the closing price to create a smoothed signal, which is essentially a price series modulated by a sine wave.
* RSI: The traditional RSI is then calculated on this smoothed signal, providing a measure of the speed and change of price movements relative to recent price changes.
Calculation Steps:
* Wave Function Calculation:
* A sinusoidal wave is generated based on the bar index and the frequency parameter.
* The wave is combined with the closing price using a weighted average, where the decay factor determines the weight given to previous values.
* RSI Calculation:
* The RSI is calculated on the smoothed signal using a standard RSI formula.
* Plotting:
* The RSI values are plotted on a chart, along with horizontal lines at 70 and 30 to indicate overbought and oversold conditions.
* The area between the RSI line and the overbought/oversold lines is filled with color to visually represent the market condition.
Interpretation and Usage
* Wave Function: The wave function introduces cyclical patterns into the price data, which can help identify potential turning points or momentum shifts.
* RSI: The RSI provides a measure of the speed and change of price movements relative to recent price changes. When applied to the smoothed signal, it can help identify overbought and oversold conditions, as well as potential divergences between price and momentum.
* Combined Indicator: The combination of the wave function and RSI aims to provide a more sensitive and potentially earlier indication of market reversals.
* Signals:
* Crossovers: Crossovers of the RSI line above or below the overbought/oversold lines can be used to generate buy or sell signals.
* Divergences: Divergences between the price and the RSI can indicate a weakening trend.
* Oscillations: The amplitude and frequency of the oscillations in the RSI can provide insights into the strength and duration of market trends.
How it Reflects Market Volatility
* Amplified Volatility: The wave function can amplify the volatility of the price data, making it easier to identify potential turning points.
* Smoothing: The decay factor helps to smooth out short-term fluctuations, allowing the indicator to focus on longer-term trends.
* Sensitivity: The combination of the wave function and RSI can make the indicator more sensitive to changes in market momentum.
In essence, this custom indicator attempts to enhance traditional RSI analysis by incorporating a cyclical component that can potentially provide earlier signals of market reversals.
Note: The effectiveness of this indicator will depend on various factors, including the specific market, time frame, and the chosen values for the frequency and decay parameters. It is recommended to conduct thorough backtesting and optimize the parameters to suit your specific trading strategy.
"Relative Strength Index (RSI) " için komut dosyalarını ara
Uptrick: MultiTrend Squeeze System**Uptrick: MultiTrend Squeeze System Indicator: The Ultimate Trading Tool for Precision and Versatility 📈🔥**
### Introduction
The MultiTrend Squeeze System is a powerful, multi-faceted trading indicator designed to provide traders with precise buy and sell signals by combining the strengths of multiple technical analysis tools. This script isn't just an indicator; it's a comprehensive trading system that merges the power of SuperTrend, RSI, Volume Filtering, and Squeeze Momentum to give you an unparalleled edge in the market. Whether you're a day trader looking for short-term opportunities or a swing trader aiming to catch longer-term trends, this indicator is tailored to meet your needs.
### Key Features and Unique Aspects
1. **SuperTrend with Dynamic Adjustments 📊**
- **Adaptive SuperTrend Calculation:** The SuperTrend is a popular trend-following indicator that adjusts dynamically based on market conditions. It uses the Average True Range (ATR) to calculate upper and lower bands, which shift according to market volatility. This script takes it further by combining it with the RSI and Volume filtering to provide more accurate signals.
- **Direction Sensitivity:** The SuperTrend here is not static. It adjusts based on the direction of the previous SuperTrend value, ensuring that the indicator remains relevant even in choppy markets.
2. **RSI Integration for Overbought/Oversold Conditions 💹**
- **RSI Calculation:** The Relative Strength Index (RSI) is incorporated to identify overbought and oversold conditions, adding an extra layer of precision. This helps in filtering out false signals and ensuring that trades are taken only in optimal conditions.
- **Customizable RSI Settings:** The RSI settings are fully customizable, allowing traders to adjust the RSI length and the overbought/oversold levels according to their trading style and market.
3. **Volume Filtering for Enhanced Signal Confirmation 📉**
- **Volume Multiplier:** This unique feature integrates volume analysis, ensuring that signals are only generated when there is sufficient market participation. The Volume Multiplier can be adjusted to filter out weak signals that occur during low-volume periods.
- **Optional Volume Filtering:** Traders have the flexibility to turn the volume filter on or off, depending on their preference or market conditions. This makes the indicator versatile, allowing it to be used across different asset classes and market conditions.
4. **Squeeze Momentum Indicator (SMI) for Market Pressure Analysis 💥**
- **Squeeze Detection:** The Squeeze Momentum Indicator detects periods of market compression and expansion. This script goes beyond the traditional Bollinger Bands and Keltner Channels by incorporating true range calculations, offering a more nuanced view of market momentum.
- **Customizable Squeeze Settings:** The lengths and multipliers for both Bollinger Bands and Keltner Channels are customizable, giving traders the flexibility to fine-tune the indicator based on their specific needs.
5. **Visual and Aesthetic Customization 🎨**
- **Color-Coding for Clarity:** The indicator is color-coded to make it easy to interpret signals. Bullish trends are marked with a vibrant green color, while bearish trends are highlighted in red. Neutral or unconfirmed signals are displayed in softer tones to reduce noise.
- **Histogram Visualization:** The primary trend direction and strength are displayed as a histogram, making it easy to visualize the market's momentum at a glance. The height and color of the bars provide immediate feedback on the strength and direction of the trend.
6. **Alerts for Real-Time Trading 🚨**
- **Custom Alerts:** The script is equipped with custom alerts that notify traders when a buy or sell signal is generated. These alerts can be configured to send notifications through various channels, including email, SMS, or directly to the trading platform.
- **Immediate Reaction:** The alerts are triggered based on the confluence of SuperTrend, RSI, and Volume signals, ensuring that traders are notified only when the most robust trading opportunities arise.
7. **Comprehensive Input Customization ⚙️**
- **SuperTrend Settings:** Adjust the ATR length and factor to control the sensitivity of the SuperTrend. This allows you to adapt the indicator to different market conditions, whether you're trading a volatile cryptocurrency or a more stable stock.
- **RSI Settings:** Customize the RSI length and thresholds for overbought and oversold conditions, enabling you to tailor the indicator to your specific trading strategy.
- **Volume Settings:** The Volume Multiplier and the option to toggle the volume filter provide an additional layer of customization, allowing you to fine-tune the indicator based on market liquidity and participation.
- **Squeeze Momentum Settings:** The lengths and multipliers for Bollinger Bands and Keltner Channels can be adjusted to detect different levels of market compression, providing flexibility for both short-term and long-term traders.
### How It Works: A Deep Dive Into the Mechanics 🛠️
1. **SuperTrend Calculation:**
- The SuperTrend is calculated using the ATR, which measures market volatility. The indicator creates upper and lower bands around the price, adjusting these bands based on the current level of market volatility. The direction of the trend is determined by the position of the price relative to these bands.
- The script enhances the standard SuperTrend by ensuring that the bands do not flip-flop too quickly, reducing the chances of false signals in a choppy market. The direction is confirmed by checking the position of the close relative to the previous band, making the trend detection more reliable.
2. **RSI Integration:**
- The RSI is calculated over a customizable length and compared to user-defined overbought and oversold levels. When the RSI crosses below the oversold level, and the SuperTrend indicates a bullish trend, a buy signal is generated. Conversely, when the RSI crosses above the overbought level, and the SuperTrend indicates a bearish trend, a sell signal is triggered.
- The combination of RSI with SuperTrend ensures that trades are only taken when there is a strong confluence of signals, reducing the chances of entering trades during weak or indecisive market phases.
3. **Volume Filtering:**
- The script calculates the average volume over a 20-period simple moving average. The volume filter ensures that buy and sell signals are only valid when the current volume exceeds a multiple of this average, which can be adjusted by the user. This feature helps filter out weak signals that might occur during low-volume periods, such as just before a major news event or during after-hours trading.
- The volume filter is particularly useful in markets where volume spikes are common, as it ensures that signals are only generated when there is significant market interest in the direction of the trend.
4. **Squeeze Momentum:**
- The Squeeze Momentum Indicator (SMI) adds a layer of market pressure analysis. The script calculates Bollinger Bands and Keltner Channels, detecting when the market is in a "squeeze" — a period of low volatility that typically precedes a significant price move.
- When the Bollinger Bands are inside the Keltner Channels, the market is in a squeeze (compression phase). This is often a precursor to a breakout or breakdown. The script colors the histogram bars black during this phase, indicating a potential for a strong move. Once the squeeze is released, the bars are colored according to the direction of the SuperTrend, signaling a potential entry point.
5. **Integration and Signal Generation:**
- The script brings together the SuperTrend, RSI, Volume, and Squeeze Momentum to generate highly accurate buy and sell signals. A buy signal is triggered when the SuperTrend is bullish, the RSI indicates oversold conditions, and the volume filter confirms strong market participation. Similarly, a sell signal is generated when the SuperTrend is bearish, the RSI indicates overbought conditions, and the volume filter is met.
- The combination of these elements ensures that the signals are robust, reducing the likelihood of entering trades during weak or indecisive market conditions.
### Practical Applications: How to Use the MultiTrend Squeeze System 📅
1. **Day Trading:**
- For day traders, this indicator provides quick and reliable signals that can be used to enter and exit trades multiple times within a day. The volume filter ensures that you are trading during the most liquid times of the day, increasing the chances of successful trades. The Squeeze Momentum aspect helps you catch breakouts or breakdowns, which are common in intraday trading.
2. **Swing Trading:**
- Swing traders can use the MultiTrend Squeeze System to identify longer-term trends. By adjusting the ATR length and factor, you can make the SuperTrend more sensitive to catch longer-term moves. The RSI and Squeeze Momentum aspects help you time your entries and exits, ensuring that you get in early on a trend and exit before it reverses.
3. **Scalping:**
- For scalpers, the quick signals provided by this system, especially in combination with the volume filter, make it easier to take small profits repeatedly. The histogram bars give you a clear visual cue of the market's momentum, making it easier to scalp effectively.
4. **Position Trading:**
- Even position traders can benefit from this indicator by using it to confirm long-term trends. By adjusting the settings to less sensitive parameters, you can ensure that you are only entering trades when a strong trend is confirmed. The Squeeze Momentum indicator will help you stay in the trade during periods of consolidation, waiting for the next big move.
### Conclusion: Why the MultiTrend Squeeze System is a Game-Changer 🚀
The MultiTrend Squeeze System is not just another trading indicator; it’s a comprehensive trading strategy encapsulated within a single script. By combining the power
of SuperTrend, RSI, Volume Filtering, and Squeeze Momentum, this indicator provides a robust and versatile tool that can be adapted to various trading styles and market conditions.
**Why is it Unique?**
- **Multi-Dimensional Analysis:** Unlike many other indicators that rely on a single data point or calculation, this script incorporates multiple layers of analysis, ensuring that signals are based on a confluence of factors, which increases their reliability.
- **Customizability:** The vast range of input settings allows traders to tailor the indicator to their specific needs, whether they are trading forex, stocks, cryptocurrencies, or commodities.
- **Visual Clarity:** The color-coded bars, labels, and signals make it easy to interpret the market conditions at a glance, reducing the time needed to make trading decisions.
Whether you are a novice trader or an experienced market participant, the MultiTrend Squeeze System offers a powerful toolset to enhance your trading strategy, reduce risk, and maximize your potential returns. With its combination of trend analysis, momentum detection, and volume filtering, this indicator is designed to help you trade with confidence and precision in any market condition.

Relative Momentum Index with Laguerre FilterThe Relative Momentum Index
The Relative Momentum Index (RMI) is an oscillator that is a variation of the Relative Strength Index (RSI), but incorporates momentum over a variable lookback period rather than just consecutive price changes, which can help identify reversals and filter out noise.
It measures the momentum of price changes over a specified period, rather than just the magnitude of price changes like the RSI does.
It counts up and down days from the current closing price relative to the closing price a certain number of days ago (e.g. 5 days ago), instead of just comparing consecutive daily closes like the RSI
It is calculated by taking the ratio of the average upward price changes to the average downward price changes over a given period, where each change is measured from the close X days ago (X is the “momentum” period)
Like the RSI, the RMI oscillates between 0 and 100, with readings above 70 considered overbought and below 30 oversold.
In trending markets, the RMI tends to remain in overbought or oversold territory for extended periods. In trading ranges, it oscillates more predictably between the overbought and oversold levels.
The RMI is generally considered better than the RSI at identifying potential reversal points, as it incorporates a momentum factor rather than just strength.
It can be used in a similar way to the RSI for trade signals, such as buying when it rises above 30 from below, or selling when it falls below 70 from above
The Laguerre filter
A Laguerre filter is a type of infinite impulse response (IIR) filter used for smoothing signals or data. The Laguerre filter provides a way to apply variable smoothing to a signal by adjusting its pole position, allowing you to control the balance between smoothness and lag based on your preferences. It is an alternative to simple moving averages that can better preserve the shape of the original signal.

RMVH by mycroftlearnstotradeThe RMVH indicator combines several popular technical analysis tools to provide a comprehensive view of market conditions. It includes Relative Strength Index (RSI), Moving Average Convergence Divergence (MACD), Volume, and Smoothed Heiken Ashi.
RSI (Relative Strength Index):
The RSI measures the strength and speed of price movements. It oscillates between 0 and 100, with levels above 70 indicating overbought conditions and levels below 30 indicating oversold conditions.
MACD (Moving Average Convergence Divergence):
The MACD is a trend-following momentum indicator that shows the relationship between two moving averages of a security’s price. It consists of the MACD line (the difference between a short-term and a long-term moving average) and the signal line (a moving average of the MACD line). The MACD histogram represents the difference between the MACD line and the signal line.
Volume:
The volume displays the total trading volume over a specified period. It helps traders gauge the strength or weakness of price movements. Typically, high volume accompanies strong price moves, while low volume may signal a lack of conviction in the market.
Smoothed Heiken Ashi:
The Smoothed Heiken Ashi is a variation of Japanese candlestick charts that aims to filter out market noise and highlight trends more effectively. It is calculated based on the open, high, low, and close prices, resulting in smoother candlesticks compared to traditional candlestick charts.
Usage:
Traders can use the RMVH indicator to identify potential trend reversals, overbought or oversold conditions, and divergence between price and momentum. Additionally, the volume component can help confirm the strength of price movements, while the Smoothed Heiken Ashi can provide a clearer visualization of trends.
Bullish signals may occur when the RSI and MACD indicate oversold conditions, accompanied by high volume and rising Smoothed Heiken Ashi values. Conversely, bearish signals may occur when the RSI and MACD indicate overbought conditions, accompanied by high volume and declining Smoothed Heiken Ashi values.
Note:
While the RMVH indicator combines multiple technical analysis tools, traders should exercise caution and use additional analysis to confirm signals before making trading decisions. No indicator is foolproof, and market conditions can change rapidly.

RSI Confirm Trend with Williams (W%R)RSI Confirm Trend with Williams (W%R)
This is the "RSI Confirm Trend with Williams (W%R)" indicator
This is a modification of the "RSI Trends" indicator by zzzcrypto123.
What Is the Relative Strength Index (RSI)?
The relative strength index (RSI) is a momentum indicator used in technical analysis. RSI measures the speed and magnitude of a security's recent price changes to evaluate overvalued or undervalued conditions in the price of that security.
What is Williams %R?
Williams %R, also known as the Williams Percent Range, is a type of momentum indicator that moves between 0 and -100 and measures overbought and oversold levels. The Williams %R may be used to find entry and exit points in the market. The indicator is very similar to the Stochastic oscillator and is used in the same way. It was developed by Larry Williams and it compares a stock’s closing price to the high-low range over a specific period, typically 14 days or periods.
How Does "RSI Confirm Trend with Williams (W%R)" work?
This indicator combines the momentum of both RSI and Williams %R by adding upper and lower thresholds. When the thresholds are broken, this indicator changes color from gray to either green or red.
What Are The Thresholds?
The default RSI thresholds are 55 and 45. These values are configurable.
The default Williams %R thresholds are 80 and 20. These values are configurable and made positive so it can be plotted against the RSI line.
How To Use?
When the RSI exceeded the upper/lower thresholds, the RSI line color will change from gray to lighter green/red color.
When the Williams %R exceeded the upper/lower thresholds, the RSI color will change to darker green/red color signifying a strong momentum in that direction.
When the RSI color is gray, this means the RSI and Williams %R thresholds are not broken which can also signify as no trend or consolidation.
The Williams %R line is not displayed by default but can be enabled using the checkbox provided in the Style tab.
This "RSI Confirm Trend with Williams (W%R)" indicator can be combined with other technical indicators to verify the idea behind this theory.
-----------------
Disclaimer
The information contained in this indicator does not constitute any financial advice or a solicitation to buy or sell any securities of any type.
My scripts/indicators/ideas are for educational purposes only!

MADALGO's Fear and Greed OscillatorThe Fear and Greed Oscillator is a dynamic tool designed to gauge market sentiment by analyzing various components such as volatility, momentum, and volume. This indicator synthesizes multiple metrics to provide a singular view of market emotion, oscillating between fear and greed.
🔷 Calculation -
The oscillator integrates the following components, each normalized and weighted to contribute equally:
ATR (Average True Range): Represents market volatility.
MACD (Moving Average Convergence Divergence): Captures market momentum.
RSI (Relative Strength Index): Provides insights into overbought or oversold conditions.
Volume: Reflects market participation levels.
Each component is first normalized to ensure a balanced impact and then averaged to create the final oscillator value.
🔷 Color Coding -
The oscillator's plot changes color based on its value, representing market sentiment:
Green: Indicates a leaning towards greed.
Red: Suggests a leaning towards fear.
The intensity of the color represents the strength of the sentiment.
🔷 Usage -
This indicator is valuable for traders looking to understand market sentiment. It works best when combined with other forms of analysis, such as fundamental or other technical indicators, to form a comprehensive trading strategy.
🔷 Signal Lines -
Two horizontal lines represent extreme conditions:
A line for Extreme Fear.
Another for Extreme Greed.
These lines help identify when the market sentiment is at potentially unsustainable levels.
🔷 Customization -
The Fear and Greed Oscillator is designed with flexibility in mind, allowing users to adjust several parameters to match their specific analysis requirements. Understanding and utilizing these customization options can significantly enhance the indicator's relevance and effectiveness in various market conditions.
1. Length Parameters:
ATR and RSI Length: This input determines the period over which the Average True Range (ATR) and the Relative Strength Index (RSI) are calculated. Adjusting this length can affect the sensitivity of the oscillator to recent market movements. A shorter length makes the oscillator more responsive to recent changes, while a longer length smoothens it, reducing sensitivity to short-term fluctuations.
MACD Parameters: These include the Fast Length, Slow Length, and Signal Smoothing. By adjusting these, users can control how the Moving Average Convergence Divergence (MACD) component reacts to price movements. This customization is crucial for aligning the oscillator with different trading strategies, whether short-term or long-term focused.
Volume Length: This parameter sets the period for the moving average and standard deviation calculations of the volume component. Altering this length allows the oscillator to either emphasize recent volume changes or consider a broader historical context.
2. Weight Adjustments:
Component Weights: Each component (ATR, MACD, RSI, Volume) has an associated weight factor. These weights determine the relative influence of each component on the final oscillator value. Users can increase the weight of a component to give it more influence or decrease it to lessen its impact. This feature is particularly beneficial for traders who have a preference or insight into which market aspects are more indicative of fear or greed at given times.
Balancing the Components: The key to effective customization lies in balancing these weights to reflect the user's market perspective and trading style. For instance, a trader focusing on volatility might increase the weight of the ATR, while one interested in momentum might prioritize the MACD and RSI weights.
3. Color and Signal Line Customization:
Color Intensity: The intensity of the color gradient of the oscillator line can be a visual aid in quickly identifying market sentiment. Users can experiment with the colorValue calculation within the script to adjust how rapidly the color changes with the oscillator values
Extreme Levels: The extreme fear and greed levels, represented by horizontal lines, are customizable. Users can set these levels based on historical data analysis or personal risk tolerance. These lines act as alerts for potentially overextended market conditions.
🔷 Limitations -
As with any technical tool, the Fear and Greed Oscillator should not be used in isolation. It does not predict market direction but rather gauges the prevailing market emotion. Its effectiveness may vary across different markets and timeframes.
🔷 Conclusion -
The Fear and Greed Oscillator offers a unique perspective on market sentiment, encapsulating various aspects of market behavior into a single indicator. It serves as a versatile tool for traders aiming to understand the emotional undercurrents of the market.
🔷 Risk Disclaimer -
Financial trading involves significant risk. The value of investments can fluctuate, and past performance is not indicative of future results. This indicator is for informational purposes and should not be construed as financial advice. Always consider your personal circumstances and seek independent advice before making financial decisions.

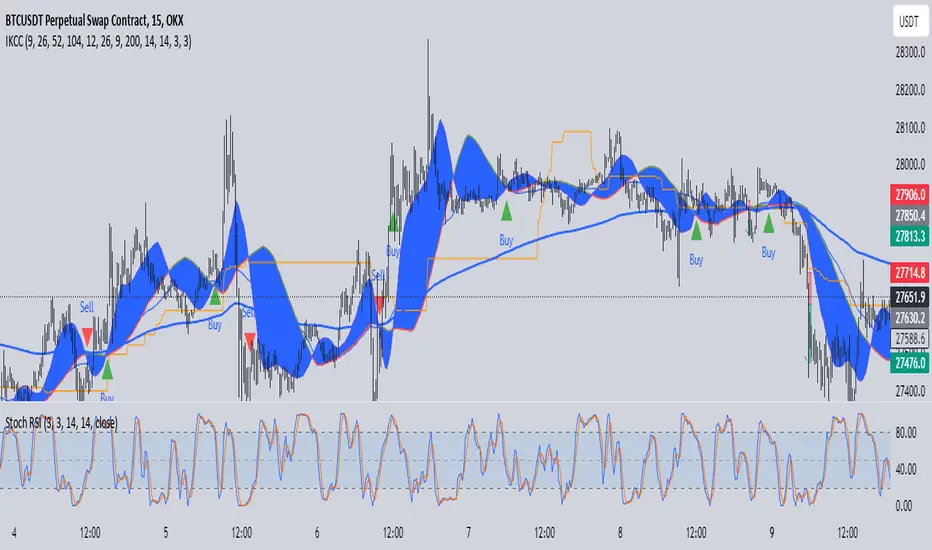
IchimokuBuy Sell With Stoch RSIIchimoku Kumo Cloud Crossover Indicator
The "Ichimoku Kumo Cloud Crossover" indicator is a custom technical analysis tool designed for use in the TradingView platform. This indicator is built to assist traders in identifying potential buy and sell signals based on a combination of Ichimoku Cloud analysis, Moving Average Convergence Divergence (MACD), Exponential Moving Average (EMA), Relative Strength Index (RSI), and Stochastic RSI.
Key Components and Parameters:
Ichimoku Kumo Cloud Calculation:
The Ichimoku Kumo Cloud is calculated using the Ichimoku Cloud's Conversion Line and Base Line.
Conversion Line, Base Line, Leading Span 1, and Leading Span 2:
These are key components of the Ichimoku Cloud, and they help identify trends and potential support/resistance levels in the market.
MACD Oscillator:
The Moving Average Convergence Divergence (MACD) is used to gauge the strength and direction of the trend.
EMA 200 (Exponential Moving Average):
The EMA 200 is a long-term moving average used to identify the overall trend direction.
RSI (Relative Strength Index):
The RSI is a momentum oscillator that measures the speed and change of price movements, helping to identify overbought and oversold conditions.
Stochastic RSI (Stoch RSI):
Stoch RSI is calculated based on the RSI values and helps to identify overbought and oversold conditions in a more dynamic manner.
Signal Generation:
The indicator generates buy and sell signals based on the following criteria:
Buy Signal (Long Position):
The Conversion Line crosses above the Base Line (Ichimoku Cloud crossover).
The closing price is above the EMA 200, indicating a bullish bias.
The RSI is between 50 and 70, suggesting the potential for an uptrend.
The MACD Histogram is positive, indicating increasing bullish momentum.
The high price is at least 25% above the EMA 200.
Sell Signal (Short Position):
The Conversion Line crosses below the Base Line (Ichimoku Cloud crossover).
The closing price is below the EMA 200, indicating a bearish bias.
The RSI is between 20 and 50, suggesting the potential for a downtrend.
The MACD Histogram is negative, indicating increasing bearish momentum.
The low price is at least 25% below the EMA 200.
Stoch RSI Filter:
Additionally, a filter based on Stoch RSI slope is applied. The indicator will only open a position if the Stoch RSI is declining for short positions (sell) and rising for long positions (buy).
Visualization:
Buy signals are marked with green triangles below the bars.
Sell signals are marked with red triangles above the bars.
The Ichimoku Cloud is plotted in the background, with cloud colors changing based on whether the Conversion Line or Base Line is higher.
This indicator can be a valuable tool for traders looking to combine multiple technical analysis techniques to make informed trading decisions in the financial markets.
Bollinger RSI BandsIndicator Description:
The "Bollinger RSI Bands" is an advanced technical analysis tool designed to empower traders with comprehensive insights into market trends, reversals, and overbought/oversold conditions. This multifaceted indicator combines the unique features of candle coloration and Bollinger Bands with the Relative Strength Index (RSI), making it an indispensable tool for traders seeking to optimize their trading strategies.
Purpose:
The primary purpose of the "Bollinger RSI Bands" indicator is to provide traders with a holistic view of market dynamics by offering the following key functionalities:
Candle Coloration: The indicator's signature candle colors - green for bullish and red for bearish - serve as a visual representation of the prevailing market trend, enabling traders to quickly identify and confirm market direction.
RSI-Based Moving Average: A smoothed RSI-based moving average is plotted, facilitating the detection of trend changes and potential reversal points with greater clarity.
RSI Bands: Upper and lower RSI bands, set at 70 and 30, respectively, help traders pinpoint overbought and oversold conditions, aiding in timely entry and exit decisions.
Bollinger Bands: In addition to RSI bands, Bollinger Bands are overlaid on the RSI-based moving average, offering insights into price volatility and highlighting potential breakout opportunities.
How to Use:
To maximize the utility of the "Bollinger RSI Bands" indicator, traders can follow these essential steps:
Candle Color Confirmation: Assess the color of the candles. Green candles signify a bullish trend, while red candles indicate a bearish trend, providing a clear and intuitive visual confirmation of market direction.
Overbought and Oversold Identification: Monitor price levels relative to the upper RSI band (70) for potential overbought signals and below the lower RSI band (30) for potential oversold signals, allowing for timely adjustments to trading positions.
Trend Reversal Recognition: Observe changes in the direction of the RSI-based moving average. A transition from bearish to bullish, or vice versa, can serve as a valuable signal for potential trend reversals.
Volatility and Breakout Opportunities: Keep a watchful eye on the Bollinger Bands. Expanding bands signify increased price volatility, often signaling forthcoming breakout opportunities.
Why Use It:
The "Bollinger RSI Bands" indicator offers traders several compelling reasons to incorporate it into their trading strategies:
Clear Trend Confirmation: The indicator's distinct candle colors provide traders with immediate confirmation of the current trend direction, simplifying trend-following strategies.
Precise Entry and Exit Points: By identifying overbought and oversold conditions, traders can make more precise entries and exits, optimizing their risk-reward ratios.
Timely Trend Reversal Signals: Recognizing shifts in the RSI-based moving average direction allows traders to anticipate potential trend reversals and adapt their strategies accordingly.
Volatility Insights: Bollinger Bands offer valuable insights into price volatility, aiding in the identification of potential breakout opportunities.
User-Friendly and Versatile: Despite its advanced features, the indicator remains user-friendly and versatile, catering to traders of all experience levels.
In summary, the "Bollinger RSI Bands" indicator is an indispensable tool for traders seeking a comprehensive view of market dynamics. With its unique combination of candle coloration and Bollinger Bands, it empowers traders to make more informed and strategic trading decisions, ultimately enhancing their trading outcomes.
Note: Always utilize this indicator in conjunction with other technical and fundamental analysis tools and exercise prudence in your trading decisions. Past performance is not indicative of future results.

Quantitative Qualitative Estimation QQE
The QQE indicator is a momentum based indicator to determine trend and sideways.
The Qualitative Quantitative Estimation (QQE) indicator works like a smoother version of the popular Relative Strength Index (RSI) indicator. QQE expands on RSI by adding two volatility based trailing stop lines. These trailing stop lines are composed of a fast and a slow moving Average True Range (ATR). These ATR lines are smoothed making this indicator less susceptible to short term volatility.
The most common method of using QQE is to look for crosses of the fast and slow moving trailing stop lines during periods when the QQE line reflects overbought or oversold conditions
Qualitative Quantitative Estimation made up of a smoothed Relative Strength Index (RSI) indicator plus fast and slow volatility-based trailing levels.
Qualitative Quantitative Estimation can be used in two directions:
1.Determine the trend, i.e. if the line is above the 50 level, the trend is ascending, if below - descending;
2.Search for signals at the moment of crossing of the QQE FAST (maroon) and QQE SLOW (blue) lines.
The QQE itself is generally considered to indicate an up-trend ifQQE FAST is above QQE SLOW, and a down-trend if below QQE SLOW.
Often a middle-range between 40 and 60 is set and if the indicator is in that range, then the market is considered to be tracking sideways, or in no trend.
You will need to set only one parameter – “SF” "RSI SMoothing Factor", an analogue of the period in RSI.
By the way, judging from the open source information, the algorithm used the standard strength index with a period of 14 for calculations.
Various signals can be created from the indicator such as:
-Buy when QQE FAST crosses above QQE SLOW below 50 level or just buy when QQE lines crosses above 50 level.
-Sell when QQE FAST crosses below QQE SLOW above 50 level or just sell when QQE lines crosses below 50 level.
WARNING: QQE IS A RSI BASED INDICATOR SO THAT IT CAN TRIGGER FALSE SIGNALS DURING DIVERGENCES!
Kıvanç Özbilgiç

Bollinger Bands (SMA 21, 2.618σ)Indicator Description: Bollinger Bands (2.618σ, 21 SMA) + RSI with Fibonacci
This custom indicator combines Bollinger Bands and Relative Strength Index (RSI), enhanced with Fibonacci-based configurations, to provide confluence signals for rejection candles, reversal setups, and continuation patterns.
Bollinger Bands Settings (Customized)
Middle Band → 21-period Simple Moving Average (SMA)
Upper Band → SMA + 2.618 standard deviations
Lower Band → SMA − 2.618 standard deviations
These parameters expand the bands compared to the traditional (20, 2.0) settings, making them better suited for volatility extremes and higher timeframe swing analysis.
Color Scheme
Middle Band = Orange
Upper Band = Red
Lower Band = Green
This color-coding emphasizes key rejection levels visually.
Candle Rejection Logic
The indicator is designed to highlight potential rejection candles when price interacts with the outer Bollinger Bands:
At the Upper Band, rejection signals suggest overextension and potential downside reaction.
At the Lower Band, rejection signals suggest oversold conditions and potential upside reaction.
Rejection Candle Types Tracked
Hammer (bullish reversal, lower rejection wick at bottom band)
Inverted Hammer (bearish reversal, upper rejection wick at top band)
Doji candles (indecision at band extremes)
Double Top formations near the upper band
Double Bottom formations near the lower band
Relative Strength Index (RSI) Settings
RSI is configured with Fibonacci retracement levels instead of traditional 30/70 thresholds.
Fibonacci sequence levels used include:
23.6% (0.236)
38.2% (0.382)
50% (0.5)
61.8% (0.618)
78.6% (0.786)
This alignment with Fibonacci ratios provides deeper market structure insights into momentum strength and exhaustion points.
Trading Confluence Zones
Upper Band + RSI at 0.618–0.786 zone → High probability bearish rejection.
Lower Band + RSI at 0.236–0.382 zone → High probability bullish reversal.
Band interaction + Doji or Hammer candles → Stronger signal confirmation.
Use Cases
Identifying trend exhaustion when price repeatedly fails to break above the upper band.
Spotting accumulation or distribution phases when price consolidates around Fibonacci-based RSI zones.
Detecting false breakouts when candle patterns (like Doji or Inverted Hammer) occur beyond the bands.
Why 2.618 Deviation & 21 SMA?
Standard Bollinger Bands (20, 2.0) capture ~95% of price action.
By widening to 2.618σ, we target extreme volatility outliers — areas where reversals are statistically more likely.
A 21-period SMA aligns better with common cycle lengths (3 trading weeks on daily charts) and Fibonacci-related time cycles.
Practical Strategy
Step 1: Watch when price touches or pierces the upper/lower band.
Step 2: Check for candle rejection patterns (Hammer, Inverted Hammer, Doji, Double Top/Bottom).
Step 3: Confirm with RSI Fibonacci levels for confluence.
Step 4: Trade with the prevailing trend or look for reversal setups if multiple confluence factors align.
Cautions
Not all touches of the bands signal reversals — strong trends can ride along the bands for extended periods.
Always combine with price action structure, volume, and higher timeframe trend bias.
📌 Summary
This indicator blends volatility-based bands with Fibonacci momentum analysis and classical candle rejection patterns. The combination of Bollinger Bands (21, 2.618σ) and RSI Fibonacci levels helps traders detect high-probability rejection zones, reversal opportunities, and overextended conditions with improved accuracy over traditional default settings.

Supertrend StrategyThe Supertrend Strategy was created based on the Supertrend and Relative Strength Index (RSI) indicators, widely respected tools in technical analysis. This strategy combines these two indicators to capture market trends with precision and reliability, looking for optimizing exit levels at oversold or overbought price levels.
The Supertrend indicator identifies trend direction based on price and volatility by using the Average True Range (ATR). The ATR measures market volatility by calculating the average range between an asset’s high and low prices over a set period. It provides insight into price fluctuations, with higher ATR values indicating increased volatility and lower values suggesting stability. The Supertrend Indicator plots a line above or below the price, signaling potential buy or sell opportunities: when the price closes above the Supertrend line, an uptrend is indicated, while a close below the line suggests a downtrend. This line shifts as price movements and volatility levels change, acting as both a trailing stop loss and trend confirmation.
To enhance the Supertrend strategy, the Relative Strength Index (RSI) has been added as an exit criterion. As a momentum oscillator, the RSI indicates overbought (usually above 70) or oversold (usually below 30) conditions. This integration allows trades to close when the asset is overbought or oversold, capturing gains before a possible reversal, even if the percentage take profit level has not been reached. This mechanism aims to prevent losses due to market reversals before the Supertrend signal changes.
### Key Features
1. **Entry criteria**:
- The strategy uses the Supertrend indicator calculated by adding or subtracting a multiple of the ATR from the closing price, depending on the trend direction.
- When the price crosses above the Supertrend line, the strategy signals a long (buy) entry. Conversely, when the price crosses below, it signals a short (sell) entry.
- The strategy performs a reversal if there is an open position and a change in the direction of the supertrend occurs
2. **Exit criteria**:
- Take profit of 30% (default) on the average position price.
- Oversold (≤ 5) or overbought (≥ 95) RSI
- Reversal when there is a change in direction of the Supertrend
3. **No Repainting**:
- This strategy is not subject to repainting, as long as the timeframe configured on your chart is the same as the supertrend timeframe .
4. **Position Sizing by Equity and risk management**:
- This strategy has a default configuration to operate with 35% of the equity. At the time of opening the position, the supertrend line is typically positioned at about 12 to 16% of the entry price. This way, the strategy is putting at risk about 16% of 35% of equity, that is, around 5.6% of equity for each trade. The percentage of equity can be adjusted by the user according to their risk management.
5. **Backtest results**:
- This strategy was subjected to deep backtesting and operations in replay mode, including transaction fees of 0.12%, and slippage of 5 ticks.
- The past results in deep backtest and replay mode were compatible and profitable (Variable results depending on the take profit used, supertrend and RSI parameters). However, it should be noted that few operations were evaluated, since the currency in question has been created for a short time and the frequency of operations is relatively small.
- Past results are no guarantee of future results. The strategy's backtest results may even be due to overfitting with past data.
Default Settings
Chart timeframe: 2h
Supertrend Factor: 3.42
ATR period: 14
Supertrend timeframe: 2 h
RSI timeframe: 15 min
RSI Lenght: 5 min
RSI Upper limit: 95
RSI Lower Limit: 5
Take Profit: 30%
BYBIT:1000000MOGUSDT.P

Simple RSI stock Strategy [1D] The "Simple RSI Stock Strategy " is designed to long-term traders. Strategy uses a daily time frame to capitalize on signals generated by the Relative Strength Index (RSI) and the Simple Moving Average (SMA). This strategy is suitable for low-leverage trading environments and focuses on identifying potential buy opportunities when the market is oversold, while incorporating strong risk management with both dynamic and static Stop Loss mechanisms.
This strategy is recommended for use with a relatively small amount of capital and is best applied by diversifying across multiple stocks in a strong uptrend, particularly in the S&P 500 stock market. It is specifically designed for equities, and may not perform well in other markets such as commodities, forex, or cryptocurrencies, where different market dynamics and volatility patterns apply.
Indicators Used in the Strategy:
1. RSI (Relative Strength Index):
- The RSI is a momentum oscillator used to identify overbought and oversold conditions in the market.
- This strategy enters long positions when the RSI drops below the oversold level (default: 30), indicating a potential buying opportunity.
- It focuses on oversold conditions but uses a filter (SMA 200) to ensure trades are only made in the context of an overall uptrend.
2. SMA 200 (Simple Moving Average):
- The 200-period SMA serves as a trend filter, ensuring that trades are only executed when the price is above the SMA, signaling a bullish market.
- This filter helps to avoid entering trades in a downtrend, thereby reducing the risk of holding positions in a declining market.
3. ATR (Average True Range):
- The ATR is used to measure market volatility and is instrumental in setting the Stop Loss.
- By multiplying the ATR value by a custom multiplier (default: 1.5), the strategy dynamically adjusts the Stop Loss level based on market volatility, allowing for flexibility in risk management.
How the Strategy Works:
Entry Signals:
The strategy opens long positions when RSI indicates that the market is oversold (below 30), and the price is above the 200-period SMA. This ensures that the strategy buys into potential market bottoms within the context of a long-term uptrend.
Take Profit Levels:
The strategy defines three distinct Take Profit (TP) levels:
TP 1: A 5% from the entry price.
TP 2: A 10% from the entry price.
TP 3: A 15% from the entry price.
As each TP level is reached, the strategy closes portions of the position to secure profits: 33% of the position is closed at TP 1, 66% at TP 2, and 100% at TP 3.
Visualizing Target Points:
The strategy provides visual feedback by plotting plotshapes at each Take Profit level (TP 1, TP 2, TP 3). This allows traders to easily see the target profit levels on the chart, making it easier to monitor and manage positions as they approach key profit-taking areas.
Stop Loss Mechanism:
The strategy uses a dual Stop Loss system to effectively manage risk:
ATR Trailing Stop: This dynamic Stop Loss adjusts based on the ATR value and trails the price as the position moves in the trader’s favor. If a price reversal occurs and the market begins to trend downward, the trailing stop closes the position, locking in gains or minimizing losses.
Basic Stop Loss: Additionally, a fixed Stop Loss is set at 25%, limiting potential losses. This basic Stop Loss serves as a safeguard, automatically closing the position if the price drops 25% from the entry point. This higher Stop Loss is designed specifically for low-leverage trading, allowing more room for market fluctuations without prematurely closing positions.
to determine the level of stop loss and target point I used a piece of code by RafaelZioni, here is the script from which a piece of code was taken
Together, these mechanisms ensure that the strategy dynamically manages risk while offering robust protection against significant losses in case of sharp market downturns.
The position size has been estimated by me at 75% of the total capital. For optimal capital allocation, a recommended value based on the Kelly Criterion, which is calculated to be 59.13% of the total capital per trade, can also be considered.
Enjoy !

Uptrick: Market MoodsThe "Uptrick: Market Moods" indicator is an advanced technical analysis tool designed for the TradingView platform. It combines three powerful indicators—Relative Strength Index (RSI), Average True Range (ATR), and Bollinger Bands—into one cohesive framework, aimed at helping traders better understand and interpret market sentiment. By capturing shifts in the emotional climate of the market, it provides a holistic view of market conditions, which can range from calm to stressed or even highly excited. This multi-dimensional analysis tool stands apart from traditional single-indicator approaches by offering a more complete picture of market dynamics, making it a valuable resource for traders looking to anticipate and react to changes in market behavior.
The RSI in the "Uptrick: Market Moods" indicator is used to measure momentum. RSI is an essential component of many technical analysis strategies, and in this tool, it is used to identify potential market extremes. When RSI values are high, they indicate an overbought condition, meaning the market may be approaching a peak. Conversely, low RSI values suggest an oversold condition, signaling that the market could be nearing a bottom. These extremes provide crucial clues about shifts in market sentiment, helping traders gauge whether the current emotional state of the market is likely to result in a reversal. This understanding is pivotal in predicting whether the market is transitioning from calm to stressed or from excited to overbought.
The Average True Range adds another layer to this analysis by offering insights into market volatility. Volatility is a key factor in understanding the mood of the market, as periods of high volatility often reflect high levels of excitement or stress, while low volatility typically indicates a calm, steady market. ATR is calculated based on the range of price movements over a given period, and the higher the value, the more volatile the market is. The "Uptrick: Market Moods" indicator uses ATR to dynamically gauge volatility levels, helping traders understand whether the market is currently moving in a way that aligns with its emotional mood. For example, an increase in ATR accompanied by an RSI value that indicates overbought conditions could suggest that the market is in a highly excited state, with the potential for either strong momentum continuation or a sharp reversal.
Bollinger Bands complement these tools by providing visual cues about price volatility and the range within which the market is likely to move. Bollinger Bands plot two standard deviations away from a simple moving average of the price. This banding technique helps traders visualize how far the price is likely to deviate from its average over a certain period. The "Uptrick: Market Moods" indicator uses Bollinger Bands to establish price boundaries and identify breakout conditions. When prices break above the upper band or below the lower band, it often signals that the market is either highly stressed or excited. This breakout condition serves as a visual representation of the market mood, alerting traders to moments when prices are moving beyond typical ranges and when significant emotional shifts are occurring in the market.
Technically, the "Uptrick: Market Moods" indicator has been developed using TradingView’s Pine Script language, a highly efficient language for building custom indicators. It employs functions like ta.rsi, ta.atr, and ta.sma to perform the necessary calculations. The use of these built-in functions ensures that the calculations are both accurate and efficient, allowing the indicator to operate in real-time without lagging, even in volatile market conditions. The ta.rsi function is used to compute the Relative Strength Index, while ta.atr calculates the Average True Range, and ta.sma is used to smooth out price data for the Bollinger Bands. These functions are applied dynamically within the script, allowing the "Uptrick: Market Moods" indicator to respond to changes in market conditions in real time.
The user interface of the "Uptrick: Market Moods" indicator is designed to provide a visually intuitive experience. The market mood is color-coded on the chart, making it easy for traders to identify whether the market is calm, stressed, or excited at a glance. This feature is especially useful for traders who need to make quick decisions in fast-moving markets. Additionally, the indicator includes an interactive table that updates in real-time, showing the most recent mood state and its frequency. This provides valuable statistical insights into market behavior over specific time frames, helping traders track the dominant emotional state of the market. Whether the market is in a prolonged calm state or rapidly transitioning through moods, this real-time feedback offers actionable data that can help traders adjust their strategies accordingly.
The RSI component of the "Uptrick: Market Moods" indicator helps detect the speed and direction of price movements, offering insight into whether the market is approaching extreme conditions. By providing signals based on overbought and oversold levels, the RSI helps traders decide whether to enter or exit positions. The ATR element acts as a volatility gauge, dynamically adjusting traders’ expectations in response to changes in market volatility. Meanwhile, the Bollinger Bands help identify trends and potential breakout conditions, serving as an additional confirmation tool that highlights when the price has moved beyond normal boundaries, indicating heightened market excitement or stress.
Despite the robust capabilities of the "Uptrick: Market Moods" indicator, it does have limitations. In markets affected by sudden shifts, such as those driven by major news events or external economic factors, the indicator’s performance may not always be reliable. These external factors can cause rapid mood swings that are difficult for any technical analysis tool to fully anticipate. Additionally, the indicator’s complexity may pose a learning curve for novice traders, particularly those who are unfamiliar with the concepts of RSI, ATR, and Bollinger Bands. However, with practice, traders can become proficient in using the tool to its full potential, leveraging the insights it provides to better navigate market shifts.
For traders seeking a deeper understanding of market sentiment, the "Uptrick: Market Moods" indicator is an invaluable resource. It is recommended for those dealing with medium to high volatility instruments, where understanding emotional shifts can offer a strategic advantage. While it can be used on its own, integrating it with other forms of analysis, such as fundamental analysis and additional technical indicators, can enhance its effectiveness. By confirming signals with other tools, traders can reduce the likelihood of false signals and improve their overall trading strategy.
To further enhance the accuracy of the "Uptrick: Market Moods" indicator, it can be integrated with volume-based tools like Volume Profile or On-Balance Volume (OBV). This combination allows traders to confirm the moods identified by the indicator with volume data, providing additional confirmation of market sentiment. For example, when the market is in an excited mood, an increase in trading volume could reinforce the reliability of that signal. Conversely, if the market is stressed but volume remains low, traders may want to proceed with caution. Using multiple indicators together creates a more comprehensive trading approach, helping traders better manage risk and make informed decisions based on multiple data points.
In conclusion, the "Uptrick: Market Moods" indicator is a powerful and unique addition to the suite of technical analysis tools available on TradingView. It provides traders with a multi-dimensional view of market sentiment by combining the analytical strengths of RSI, ATR, and Bollinger Bands into a single tool. Its ability to capture and interpret the emotional mood of the market makes it an essential tool for traders seeking to gain an edge in understanding market behavior. While the indicator has certain limitations, particularly in rapidly shifting markets, its ability to provide real-time insights into market sentiment is a valuable asset for traders of all experience levels. Used in conjunction with other tools and sound trading practices, the "Uptrick: Market Moods" indicator offers a comprehensive solution for navigating the complexities of financial markets.

Post-Open Long Strategy with ATR-based Stop Loss and Take ProfitThe "Post-Open Long Strategy with ATR-Based Stop Loss and Take Profit" is designed to identify buying opportunities after the German and US markets open. It combines various technical indicators to filter entry signals, focusing on breakout moments following price lateralization periods.
Key Components and Their Interaction:
Bollinger Bands (BB):
Description: Uses BB with a 14-period length and standard deviation multiplier of 1.5, creating narrower bands for lower timeframes.
Role in the Strategy: Identifies low volatility phases (lateralization). The lateralization condition is met when the price is near the simple moving average of the BB, suggesting an imminent increase in volatility.
Exponential Moving Averages (EMA):
10-period EMA: Quickly detects short-term trend direction.
200-period EMA: Filters long-term trends, ensuring entries occur in a bullish market.
Interaction: Positions are entered only if the price is above both EMAs, indicating a consolidated positive trend.
Relative Strength Index (RSI):
Description: 7-period RSI with a threshold above 30.
Role in the Strategy: Confirms the market is not oversold, supporting the validity of the buy signal.
Average Directional Index (ADX):
Description: 7-period ADX with 7-period smoothing and a threshold above 10.
Role in the Strategy: Assesses trend strength. An ADX above 10 indicates sufficient momentum to justify entry.
Average True Range (ATR) for Dynamic Stop Loss and Take Profit:
Description: 14-period ATR with multipliers of 2.0 for Stop Loss and 4.0 for Take Profit.
Role in the Strategy: Adjusts exit levels based on current volatility, enhancing risk management.
Resistance Identification and Breakout:
Description: Analyzes the highs of the last 20 candles to identify resistance levels with at least two touches.
Role in the Strategy: A breakout above this level signals a potential continuation of the bullish trend.
Time Filters and Market Conditions:
Trading Hours: Operates only during the opening of the German market (8:00 - 12:00) and US market (15:30 - 19:00).
Panic Candle: The current candle must close negative, leveraging potential emotional reactions in the market.
Avoiding Entry During Pullbacks:
Description: Checks that the two previous candles are not both bearish.
Role in the Strategy: Avoids entering during a potential pullback, improving trade success probability.
Post-Open Long Strategy with ATR-Based Stop Loss and Take Profit
The "Post-Open Long Strategy with ATR-Based Stop Loss and Take Profit" is designed to identify buying opportunities after the German and US markets open. It combines various technical indicators to filter entry signals, focusing on breakout moments following price lateralization periods.
Key Components and Their Interaction:
Bollinger Bands (BB):
Description: Uses BB with a 14-period length and standard deviation multiplier of 1.5, creating narrower bands for lower timeframes.
Role in the Strategy: Identifies low volatility phases (lateralization). The lateralization condition is met when the price is near the simple moving average of the BB, suggesting an imminent increase in volatility.
Exponential Moving Averages (EMA):
10-period EMA: Quickly detects short-term trend direction.
200-period EMA: Filters long-term trends, ensuring entries occur in a bullish market.
Interaction: Positions are entered only if the price is above both EMAs, indicating a consolidated positive trend.
Relative Strength Index (RSI):
Description: 7-period RSI with a threshold above 30.
Role in the Strategy: Confirms the market is not oversold, supporting the validity of the buy signal.
Average Directional Index (ADX):
Description: 7-period ADX with 7-period smoothing and a threshold above 10.
Role in the Strategy: Assesses trend strength. An ADX above 10 indicates sufficient momentum to justify entry.
Average True Range (ATR) for Dynamic Stop Loss and Take Profit:
Description: 14-period ATR with multipliers of 2.0 for Stop Loss and 4.0 for Take Profit.
Role in the Strategy: Adjusts exit levels based on current volatility, enhancing risk management.
Resistance Identification and Breakout:
Description: Analyzes the highs of the last 20 candles to identify resistance levels with at least two touches.
Role in the Strategy: A breakout above this level signals a potential continuation of the bullish trend.
Time Filters and Market Conditions:
Trading Hours: Operates only during the opening of the German market (8:00 - 12:00) and US market (15:30 - 19:00).
Panic Candle: The current candle must close negative, leveraging potential emotional reactions in the market.
Avoiding Entry During Pullbacks:
Description: Checks that the two previous candles are not both bearish.
Role in the Strategy: Avoids entering during a potential pullback, improving trade success probability.
Entry and Exit Conditions:
Long Entry:
The price breaks above the identified resistance.
The market is in a lateralization phase with low volatility.
The price is above the 10 and 200-period EMAs.
RSI is above 30, and ADX is above 10.
No short-term downtrend is detected.
The last two candles are not both bearish.
The current candle is a "panic candle" (negative close).
Order Execution: The order is executed at the close of the candle that meets all conditions.
Exit from Position:
Dynamic Stop Loss: Set at 2 times the ATR below the entry price.
Dynamic Take Profit: Set at 4 times the ATR above the entry price.
The position is automatically closed upon reaching the Stop Loss or Take Profit.
How to Use the Strategy:
Application on Volatile Instruments:
Ideal for financial instruments that show significant volatility during the target market opening hours, such as indices or major forex pairs.
Recommended Timeframes:
Intraday timeframes, such as 5 or 15 minutes, to capture significant post-open moves.
Parameter Customization:
The default parameters are optimized but can be adjusted based on individual preferences and the instrument analyzed.
Backtesting and Optimization:
Backtesting is recommended to evaluate performance and make adjustments if necessary.
Risk Management:
Ensure position sizing respects risk management rules, avoiding risking more than 1-2% of capital per trade.
Originality and Benefits of the Strategy:
Unique Combination of Indicators: Integrates various technical metrics to filter signals, reducing false positives.
Volatility Adaptability: The use of ATR for Stop Loss and Take Profit allows the strategy to adapt to real-time market conditions.
Focus on Post-Lateralization Breakout: Aims to capitalize on significant moves following consolidation periods, often associated with strong directional trends.
Important Notes:
Commissions and Slippage: Include commissions and slippage in settings for more realistic simulations.
Capital Size: Use a realistic trading capital for the average user.
Number of Trades: Ensure backtesting covers a sufficient number of trades to validate the strategy (ideally more than 100 trades).
Warning: Past results do not guarantee future performance. The strategy should be used as part of a comprehensive trading approach.
With this strategy, traders can identify and exploit specific market opportunities supported by a robust set of technical indicators and filters, potentially enhancing their trading decisions during key times of the day.

Bollinger Bands with RSI Buy/Sell Signals (15 min) Bollinger Bands with RSI Buy/Sell Signals (15 Min)
Description:
The Bollinger Bands with RSI Buy/Sell Signals (15 Min) indicator is designed to help traders identify potential reversal points in the market using two popular technical indicators: Bollinger Bands and the Relative Strength Index (RSI).
How It Works:
Bollinger Bands:
Bollinger Bands consist of an upper band, lower band, and a middle line (Simple Moving Average). These bands adapt to market volatility, expanding during high volatility and contracting during low volatility.
This indicator monitors the 15-minute Bollinger Bands. If the price moves completely outside the bands, it signals that the market is potentially overextended.
Relative Strength Index (RSI):
RSI is a momentum indicator that measures the strength of price movements. RSI readings above 70 indicate an overbought condition, while readings below 30 suggest an oversold condition.
This indicator uses the RSI on the 15-minute time frame to further confirm overbought and oversold conditions.
Buy/Sell Signal Generation:
Buy Signal:
A buy signal is triggered when the market price crosses above the lower Bollinger Band on the 15-minute time frame, indicating that the market may be oversold.
Additionally, the RSI must be below 30, confirming an oversold condition.
A "Buy" label appears below the price when this condition is met.
Sell Signal:
A sell signal is triggered when the market price crosses below the upper Bollinger Band on the 15-minute time frame, indicating that the market may be overbought.
The RSI must be above 70, confirming an overbought condition.
A "Sell" label appears above the price when this condition is met.

Uptrick: Trend SMA Oscillator### In-Depth Analysis of the "Uptrick: Trend SMA Oscillator" Indicator
---
#### Introduction to the Indicator
The "Uptrick: Trend SMA Oscillator" is an advanced yet user-friendly technical analysis tool designed to help traders across all levels of experience identify and follow market trends with precision. This indicator builds upon the fundamental principles of the Simple Moving Average (SMA), a cornerstone of technical analysis, to deliver a clear, visually intuitive overlay on the price chart. Through its strategic use of color-coding and customizable parameters, the Uptrick: Trend SMA Oscillator provides traders with actionable insights into market dynamics, enhancing their ability to make informed trading decisions.
#### Core Concepts and Methodology
1. **Foundational Principle – Simple Moving Average (SMA):**
- The Simple Moving Average (SMA) is the heart of the Uptrick: Trend SMA Oscillator. The SMA is a widely-used technical indicator that calculates the average price of an asset over a specified number of periods. By smoothing out price data, the SMA helps to reduce the noise from short-term fluctuations, providing a clearer picture of the overall trend.
- In the Uptrick: Trend SMA Oscillator, two SMAs are employed:
- **Primary SMA (oscValue):** This is applied to the closing price of the asset over a user-defined period (default is 14 periods). This SMA tracks the price closely and is sensitive to changes in market direction.
- **Smoothing SMA (oscV):** This second SMA is applied to the primary SMA, further smoothing the data and helping to filter out minor price movements that might otherwise be mistaken for trend reversals. The default period for this smoothing is 50, but it can be adjusted to suit the trader's preference.
2. **Color-Coding for Trend Visualization:**
- One of the most distinctive features of this indicator is its use of color to represent market trends. The indicator’s line changes color based on the relationship between the primary SMA and the smoothing SMA:
- **Bullish (Green):** The line turns green when the primary SMA is equal to or greater than the smoothing SMA, indicating that the market is in an upward trend.
- **Bearish (Red):** Conversely, the line turns red when the primary SMA falls below the smoothing SMA, signaling a downward trend.
- This color-coded system provides traders with an immediate, easy-to-interpret visual cue about the market’s direction, allowing for quick decision-making.
#### Detailed Explanation of Inputs
1. **Bullish Color (Default: Green #00ff00):**
- This input allows traders to customize the color that represents bullish trends on the chart. The default setting is green, a color commonly associated with upward market movement. However, traders can adjust this to any color that suits their visual preferences or matches their overall chart theme.
2. **Bearish Color (Default: Red RGB: 245, 0, 0):**
- The bearish color input determines the color of the line when the market is trending downwards. The default setting is a vivid red, signaling caution or selling opportunities. Like the bullish color, this can be customized to fit the trader’s needs.
3. **Line Thickness (Default: 5):**
- This setting controls the thickness of the line plotted by the indicator. The default thickness of 5 makes the line prominent on the chart, ensuring that the trend is easily visible even in complex or crowded chart setups. Traders can adjust the thickness to make the line thinner or thicker, depending on their visual preferences.
4. **Primary SMA Period (Value 1 - Default: 14):**
- The primary SMA period defines how many periods (e.g., days, hours) are used to calculate the moving average based on the asset’s closing prices. The default period of 14 is a balanced setting that offers a good mix of responsiveness and stability, but traders can adjust this depending on their trading style:
- **Shorter Periods (e.g., 5-10):** These make the indicator more sensitive, capturing trends more quickly but also increasing the likelihood of reacting to short-term price fluctuations or "noise."
- **Longer Periods (e.g., 20-50):** These smooth the data more, providing a more stable trend line that is less prone to whipsaws but may be slower to respond to trend changes.
5. **Smoothing SMA Period (Value 2 - Default: 50):**
- The smoothing SMA period determines how much the primary SMA is smoothed. A longer smoothing period results in a more gradual, stable line that focuses on the broader trend. The default of 50 is designed to smooth out most of the short-term fluctuations while still being responsive enough to detect significant trend shifts.
- **Customization:**
- **Shorter Smoothing Periods (e.g., 20-30):** Make the indicator more responsive, better for fast-moving markets or for traders who want to capture quick trends.
- **Longer Smoothing Periods (e.g., 70-100):** Enhance stability, ideal for long-term traders looking to avoid reacting to minor price movements.
#### Unique Characteristics and Advantages
1. **Simplicity and Clarity:**
- The Uptrick: Trend SMA Oscillator’s design prioritizes simplicity without sacrificing effectiveness. By relying on the widely understood SMA, it avoids the complexity of more esoteric indicators while still providing reliable trend signals. This simplicity makes it accessible to traders of all levels, from novices who are just learning about technical analysis to experienced traders looking for a straightforward, dependable tool.
2. **Visual Feedback Mechanism:**
- The indicator’s use of color to signify market trends is a particularly powerful feature. This visual feedback mechanism allows traders to assess market conditions at a glance. The clarity of the green and red color scheme reduces the mental effort required to interpret the indicator, freeing the trader to focus on strategy execution.
3. **Adaptability Across Markets and Timeframes:**
- One of the strengths of the Uptrick: Trend SMA Oscillator is its versatility. The basic principles of moving averages apply equally well across different asset classes and timeframes. Whether trading stocks, forex, commodities, or cryptocurrencies, traders can use this indicator to gain insights into market trends.
- **Intraday Trading:** For day traders who operate on short timeframes (e.g., 1-minute, 5-minute charts), the oscillator can be adjusted to be more responsive, capturing quick shifts in momentum.
- **Swing Trading:** Swing traders, who typically hold positions for several days to weeks, will find the default settings or slightly adjusted periods ideal for identifying and riding medium-term trends.
- **Long-Term Trading:** Position traders and investors can adjust the indicator to focus on long-term trends by increasing the periods for both the primary and smoothing SMAs, filtering out minor fluctuations and highlighting sustained market movements.
4. **Minimal Lag:**
- One of the challenges with moving averages is lag—the delay between when the price changes and when the indicator reflects this change. The Uptrick: Trend SMA Oscillator addresses this by allowing traders to adjust the periods to find a balance between responsiveness and stability. While all SMAs inherently have some lag, the customizable nature of this indicator helps traders mitigate this effect to align with their specific trading goals.
5. **Customizable and Intuitive:**
- While many technical indicators come with a fixed set of parameters, the Uptrick: Trend SMA Oscillator is fully customizable, allowing traders to tailor it to their trading style, market conditions, and personal preferences. This makes it a highly flexible tool that can be adjusted as markets evolve or as a trader’s strategy changes over time.
#### Practical Applications for Different Trader Profiles
1. **Day Traders:**
- **Use Case:** Day traders can customize the SMA periods to create a faster, more responsive indicator. This allows them to capture short-term trends and make quick decisions. For example, reducing the primary SMA to 5 and the smoothing SMA to 20 can help day traders react promptly to intraday price movements.
- **Strategy Integration:** Day traders might use the Uptrick: Trend SMA Oscillator in conjunction with volume-based indicators to confirm the strength of a trend before entering or exiting trades.
2. **Swing Traders:**
- **Use Case:** Swing traders can use the default settings or slightly adjust them to smooth out minor price fluctuations while still capturing medium-term trends. This approach helps in identifying the optimal points to enter or exit trades based on the broader market direction.
- **Strategy Integration:** Swing traders can combine this indicator with oscillators like the Relative Strength Index (RSI) to confirm overbought or oversold conditions, thereby refining their entry and exit strategies.
3. **Position Traders:**
- **Use Case:** Position traders, who hold trades for extended periods, can extend the SMA periods to focus on long-term trends. By doing so, they minimize the impact of short-term market noise and focus on the underlying trend.
- **Strategy Integration:** Position traders might use the Uptrick: Trend SMA Oscillator in combination with fundamental analysis. The indicator can help confirm the timing of entries and exits based on broader economic or corporate developments.
4. **Algorithmic and Quantitative Traders:**
- **Use Case:** The simplicity and clear logic of the Uptrick: Trend SMA Oscillator make it an excellent candidate for algorithmic trading strategies. Its binary output—bullish or bearish—can be easily coded into automated trading systems.
- **Strategy Integration:** Quant traders might use the indicator as part of a larger trading system that incorporates multiple indicators and rules, optimizing the SMA periods based on historical backtesting to achieve the best results.
5. **Novice Traders:**
- **Use Case:** Beginners can use the Uptrick: Trend SMA Oscillator to learn the basics of trend-following strategies.
The visual simplicity of the color-coded line helps novice traders quickly understand market direction without the need to interpret complex data.
- **Educational Value:** The indicator serves as an excellent starting point for those new to technical analysis, providing a practical example of how moving averages work in a real-world trading environment.
#### Combining the Indicator with Other Tools
1. **Relative Strength Index (RSI):**
- The RSI is a momentum oscillator that measures the speed and change of price movements. When combined with the Uptrick: Trend SMA Oscillator, traders can look for instances where the RSI shows divergence from the price while the oscillator confirms the trend. This can be a powerful signal of an impending reversal or continuation.
2. **Moving Average Convergence Divergence (MACD):**
- The MACD is another popular trend-following momentum indicator. By using it alongside the Uptrick: Trend SMA Oscillator, traders can confirm the strength of a trend and identify potential entry and exit points with greater confidence. For example, a bullish crossover on the MACD that coincides with the Uptrick: Trend SMA Oscillator turning green can be a strong buy signal.
3. **Volume Indicators:**
- Volume is often considered the fuel behind price movements. Using volume indicators like the On-Balance Volume (OBV) or Volume Weighted Average Price (VWAP) in conjunction with the Uptrick: Trend SMA Oscillator can help traders confirm the validity of a trend. A trend identified by the oscillator that is supported by increasing volume is typically more reliable.
4. **Fibonacci Retracement:**
- Fibonacci retracement levels are used to identify potential reversal levels in a trending market. When the Uptrick: Trend SMA Oscillator indicates a trend, traders can use Fibonacci retracement levels to find potential entry points that align with the broader trend direction.
#### Implementation in Different Market Conditions
1. **Trending Markets:**
- The Uptrick: Trend SMA Oscillator excels in trending markets, where it provides clear signals on the direction of the trend. In a strong uptrend, the line will remain green, helping traders stay in the trade for longer periods. In a downtrend, the red line will signal the continuation of bearish conditions, prompting traders to stay short or avoid long positions.
2. **Sideways or Range-Bound Markets:**
- In range-bound markets, where price oscillates within a confined range without a clear trend, the Uptrick: Trend SMA Oscillator may produce more frequent changes in color. While this could indicate potential reversals at the range boundaries, traders should be cautious of false signals. It may be beneficial to pair the oscillator with a volatility indicator to better navigate such conditions.
3. **Volatile Markets:**
- In highly volatile markets, where prices can swing rapidly, the sensitivity of the Uptrick: Trend SMA Oscillator can be adjusted by modifying the SMA periods. A shorter SMA period might capture quick trends, but traders should be aware of the increased risk of whipsaws. Combining the oscillator with a volatility filter or using it in a higher time frame might help mitigate some of this risk.
#### Final Thoughts
The "Uptrick: Trend SMA Oscillator" is a versatile, easy-to-use indicator that stands out for its simplicity, visual clarity, and adaptability. It provides traders with a straightforward method to identify and follow market trends, using the well-established concept of moving averages. The indicator’s customizable nature makes it suitable for a wide range of trading styles, from day trading to long-term investing, and across various asset classes.
By offering immediate visual feedback through color-coded signals, the Uptrick: Trend SMA Oscillator simplifies the decision-making process, allowing traders to focus on execution rather than interpretation. Whether used on its own or as part of a broader technical analysis toolkit, this indicator has the potential to enhance trading strategies and improve overall performance.
Its accessibility and ease of use make it particularly appealing to novice traders, while its adaptability and reliability ensure that it remains a valuable tool for more experienced market participants. As markets continue to evolve, the Uptrick: Trend SMA Oscillator remains a timeless tool, rooted in the fundamental principles of technical analysis, yet flexible enough to meet the demands of modern trading.

ChartArt-Bankniftybuying5minName: ChartArt-BankNifty Buying Strategy (5-Minute)
Timeframe: 5-Minute Candles
Asset: BankNifty (Indian Stock Market Index)
Trading Hours: 9:30 AM - 2:45 PM IST (Indian Standard Time)
This strategy is designed for BankNifty intraday traders who want to capitalize on short-term price movements within a defined trading window. It combines technical indicators like Simple Moving Averages (SMA), Relative Strength Index (RSI), and candlestick patterns to identify potential buy signals during intraday downtrends. The strategy employs specific entry, stop-loss, and target conditions to manage trades effectively and minimize risk.
Technical Indicators Used
Simple Moving Averages (SMA):
EMA7: 7-period SMA on closing price.
EMA5: 5-period SMA on closing price.
Purpose: Used to identify the intraday trend by comparing short-term moving averages. The strategy focuses on situations where the market is in a minor downtrend, indicated by EMA5 being below EMA7.
Relative Strength Index (RSI):
RSI14: 14-period RSI, a momentum oscillator that measures the speed and change of price movements.
SMA14: 14-period SMA of the RSI.
Purpose: RSI is used to identify potential reversal points. The strategy looks for situations where the RSI is below its own moving average, suggesting weakening momentum in the downtrend.
Candlestick Patterns:
Relaxed Hammer or Doji (2nd Candle): A pattern where the second candle in a 3-candle sequence shows a potential reversal signal (Hammer or Doji), indicating indecision or a potential turning point.
Bearish 1st Candle: The first candle is bearish, setting up the context for a potential reversal.
Bullish 3rd Candle: The third candle must be bullish with specific characteristics (closing near the high, surpassing the previous high), confirming the reversal.
Strategy Conditions
Time Condition:
The strategy is only active during specific hours (9:30 AM to 2:45 PM IST). This ensures that trades are only taken during the most liquid hours of the trading day, avoiding potential volatility or lack of liquidity towards market close.
Intraday Downtrend Condition:
EMA5 < EMA7: Indicates that the market is in a minor downtrend. The strategy looks for reversal opportunities within this trend.
RSI Condition:
RSI14 <= SMA14: Indicates that the current RSI value is below its 14-period SMA, suggesting potential weakening momentum, which can precede a reversal.
Candlestick Patterns:
1st Candle: Must be bearish, setting up the context for a potential reversal.
2nd Candle: Must either be a Hammer or Doji, indicating a potential reversal pattern.
3rd Candle: Must be bullish, with specific characteristics (closing near the high, breaking the previous high, etc.), confirming the reversal.
RSI Crossover Condition:
A crossover of the RSI over its SMA in the last 5 periods is also checked, adding further confirmation to the reversal signal.
Entry and Exit Rules
Entry Signal:
A buy signal is generated when all the conditions (time, intraday downtrend, bearish 1st candle, hammer/doji 2nd candle, bullish 3rd candle, and RSI condition) are met. The trade is entered at the high of the bullish third candle.
Stop Loss:
The stop loss is calculated based on the difference between the entry price and the low of the second candle. If this difference is greater than 90 points, the stop loss is placed at the midpoint of the second candle's range (average of high and low). Otherwise, it is placed at the low of the second candle.
Target 1:
The first target is set at 1.8 times the difference between the entry price and the stop loss. When this target is hit, half of the position is exited to lock in partial profits.
Target 2:
The second target is set at 3 times the difference between the entry price and the stop loss. The remaining position is exited at this point, or if the price hits the stop loss.
Originality and Usefulness
This strategy is original in its combination of multiple technical indicators and candlestick patterns to identify potential reversals in a specific intraday timeframe. By focusing on minor downtrends and utilizing a 3-candle reversal pattern, the strategy seeks to capture quick price movements with a structured approach to risk management.
Key Benefits:
High Precision: The strategy’s multi-step filtering process (time condition, trend confirmation, candlestick pattern analysis, and momentum evaluation via RSI) increases the likelihood of accurate trade signals.
Risk Management: The use of a dynamic stop-loss based on candle characteristics, combined with partial profit-taking, allows traders to lock in profits while still giving the trade room to develop further.
Structured Approach: The strategy provides a clear, rule-based system for entering and exiting trades, which can help remove emotional decision-making from the trading process.
Charts and Signals
The strategy produces signals in the form of labels on the chart:
Buy Signal: A green label is plotted below the candle that meets all entry conditions, indicating a potential buy opportunity.
Stop Loss (SL): A red dashed line is drawn at the stop-loss level with a label indicating "SL".
Target 1 (1st TG): A blue dashed line is drawn at the first target level with a label indicating "1st TG".
Target 2 (2nd TG): Another blue dashed line is drawn at the second target level with a label indicating "2nd TG".
These visual aids help traders quickly identify entry points, stop loss levels, and target levels on the chart, making the strategy easy to follow and implement.
Backtesting and Optimization
Backtesting: The strategy can be backtested on TradingView using historical data to evaluate its performance. Traders should consider testing across different market conditions to ensure the strategy's robustness.
Optimization: Parameters such as the RSI period, moving averages, and target multipliers can be optimized based on backtesting results to refine the strategy further.
Conclusion
The ChartArt-BankNifty Buying Strategy offers a well-rounded approach to intraday trading, focusing on capturing reversals in minor downtrends. With a strong emphasis on technical analysis, precise entry and exit rules, and robust risk management, this strategy provides a solid framework for traders looking to engage in intraday trading on BankNifty.

Rise Sense Capital - RSI MACD Spot Buying IndicatorToday, I'll share a spot buying strategy shared by a member @KR陳 within the DATA Trader Alliance Alpha group. First, you need to prepare two indicators:
今天分享一個DATA交易者聯盟Alpha群組裏面的群友@KR陳分享的現貨買入策略。
首先需要準備兩個指標
RSI Indicator (Relative Strength Index) - RSI is a technical analysis tool based on price movements over a period of time to evaluate the speed and magnitude of price changes. RSI calculates the changes in price over a period to determine whether the recent trend is relatively strong (bullish) or weak (bearish).
RSI指標,(英文全名:Relative Strength Index),中文稱為「相對強弱指標」,是一種以股價漲跌為基礎,在一段時間內的收盤價,用於評估價格變動的速度 (快慢) 與變化 (幅度) 的技術分析工具,RSI藉由計算一段期間內股價的漲跌變化,判斷最近的趨勢屬於偏強 (偏多) 還是偏弱 (偏空)。
MACD Indicator (Moving Average Convergence & Divergence) - MACD is a technical analysis tool proposed by Gerald Appel in the 1970s. It is commonly used in trading to determine trend reversals by analyzing the convergence and divergence of fast and slow lines.
MACD 指標 (Moving Average Convergence & Divergence) 中文名為平滑異同移動平均線指標,MACD 是在 1970 年代由美國人 Gerald Appel 所提出,是一項歷史悠久且經常在交易中被使用的技術分析工具,原理是利用快慢線的交錯,藉以判斷股價走勢的轉折。
In MACD analysis, the most commonly used values are 12, 26, and 9, known as MACD (12,26,9). The market often uses the MACD indicator to determine the future direction of assets and to identify entry and exit points.
在 MACD 的技術分析中,最常用的值為 12 天、26 天、9 天,也稱為 MACD (12,26,9),市場常用 MACD 指標來判斷操作標的的後市走向,確定波段漲幅並找到進、出場點。
Strategy analysis by member KR陳:
策略解析 by群友 KR陳 :
Condition 1: RSI value in the previous candle is below oversold zone(30).
條件1:RSI 在前一根的數值低於超賣區(30)
buycondition1 = RSI <30
Condition 2: MACD histogram changes from decreasing to increasing.
條件2:MACD柱由遞減轉遞增
buycondition2 = hist >hist and hist
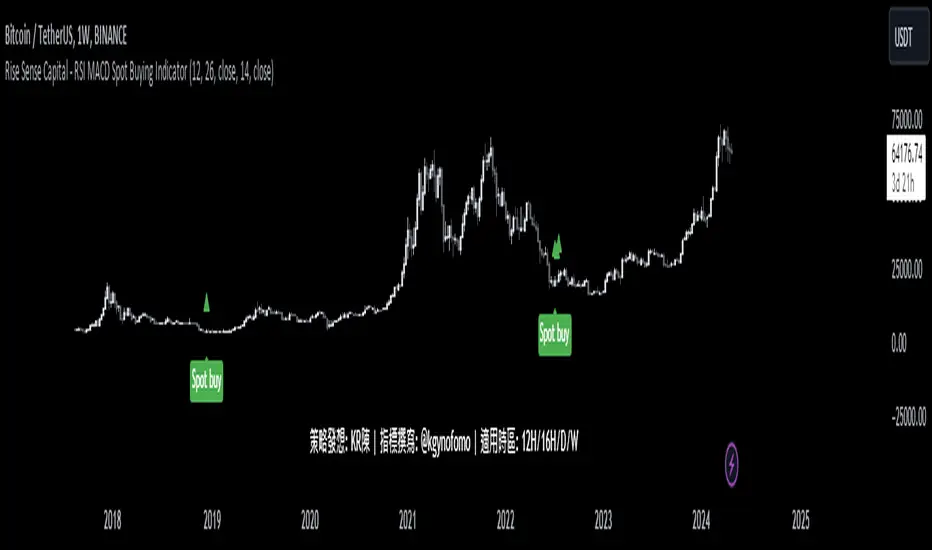
MA RSI @KINGThis Pine Script is designed to create a trading indicator with moving averages (MA) and relative strength index (RSI), along with arrow signals and background color changes based on those signals. Here's a description of its functions:
1. Moving Averages and RSI Calculation:
- Two moving averages (`fastMA` and `slowMA`) are calculated based on user-input lengths.
- The Relative Strength Index (`rsi`) is calculated based on a user-defined length.
2. Crossover Conditions:
- `crossoverUp` is true when the fastMA crosses above the slowMA and RSI is above an overbought level.
- `crossoverDown` is true when the fastMA crosses below the slowMA and RSI is below an oversold level.
3. Arrow Signals:
- Triangle-shaped arrows (`arrowUp` and `arrowDown`) are plotted below and above bars, indicating buy (green) and sell (red) signals, respectively.
4. Background Color Changes:
- The background color (`bgColor`) changes based on buy and sell signals.
- If there's a buy signal (`crossoverUp`), the background color is set to a light blue with 40% transparency.
- If there's a sell signal (`crossoverDown`), the background color is set to a light red with 40% transparency.
- On the next opposite signal, the background color is scaled up (transparency set to 80%) to indicate a stronger signal.
In summary, this script provides visual cues through arrows and background color changes to assist traders in identifying potential buy and sell signals based on moving average crossovers and RSI conditions. The background color variations aim to highlight the strength of the signal, with scaling based on consecutive signals in the same direction.
********************************************************************************
1. Buy Signal:
- Condition: The arrow points up (green) with a background color indicating a buy signal.
- Confirmation: Ensure that there is a strong upward crossover (fastMA above slowMA) and RSI is above the overbought level.
2. Sell Signal:
- Condition: The arrow points down (red) with a background color indicating a sell signal.
- Confirmation: Ensure that there is a strong downward crossover (fastMA below slowMA) and RSI is below the oversold level.
3. Exit Signal:
- Condition: No arrow is present, and the background color is reset.
- Confirmation: Confirm that there is no active buy or sell signal.
Example Trading Rules:
Opening a Long Position (Buy):
- Enter a long (buy) position when:
- The green arrow appears with a light blue background.
- Confirm that the fastMA is above the slowMA.
- Confirm that RSI is above the overbought level.
Opening a Short Position (Sell):
- Enter a short (sell) position when:
- The red arrow appears with a light red background.
- Confirm that the fastMA is below the slowMA.
- Confirm that RSI is below the oversold level.
Exiting a Position:
- Close the position when:
- There is no arrow present (neither green nor red).
- The background color is reset, indicating no active signal.
Risk Management:
Position Sizing: Determine the size of your positions based on your risk tolerance and the size of your trading account.
Stop-Loss and Take-Profit: Set stop-loss orders to limit potential losses and take-profit orders to secure profits.
Risk-Reward Ratio: Consider maintaining a favorable risk-reward ratio in your trades.
Notes:
Backtesting: Before applying this strategy in a live market, it's crucial to backtest it using historical data to assess its performance.
Market Conditions: Adapt the strategy to different market conditions, and be aware that no strategy is guaranteed to be profitable.
Continuous Monitoring: Regularly monitor the performance of the strategy and make adjustments as needed.
Educational Purpose: This strategy is for educational purposes only. Always consult with financial professionals and use your judgment when making trading decisions.
Remember that trading involves risk, and past performance is not indicative of future results. It's recommended to paper trade or use a demo account to test the strategy before risking real capital.
Best wishes on your trading journey! May your strategies be profitable, your risks well-managed, and your decisions guided by wisdom and success. Happy trading!
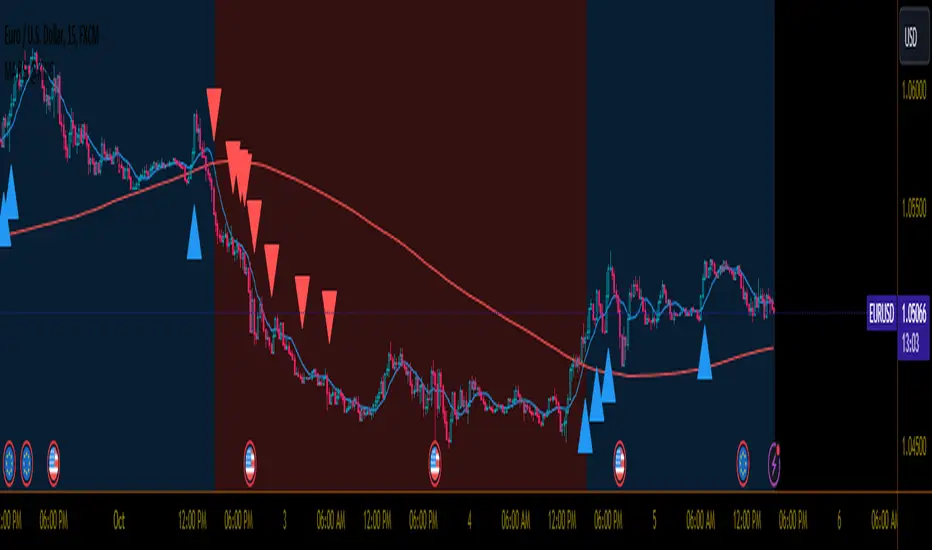
Divergences RefurbishedJust as "a butterfly can flap its wings over a flower in China and cause a hurricane in the Caribbean" (Edward Lorenz), small divergences in markets can signal big trading opportunities.
█Introduction
This is a script forked from LonesomeTheBlue's Divergence for Many Indicators v4.
It is a script that checks for divergence between price and many indicators.
In this version, I added more indicators and also added 40 symbols to check for divergences.
More info on the original script can be found here:
█ Improvements
The following improvements have been implemented over v4:
1. Added parameters to customize indicators.
2. Added new indicators:
- Stoch RSI
- Volume Oscillator
- PVT (Price Volume Trend)
- Ultimate Oscillator
- Fisher Transform
- Z-Score/T-Score
3. Now there is the possibility of using 2 external indicators.
4. New option to show tooltips inside labels.
This allows you to save space on the screen if you choose the option to only show the number of divergences or just the abbreviations.
5. New option to show additional text next to the indicator name.
This allows for grouping of indicators and symbols and better visualization, whether through emojis, for example.
6. Added 40 customizable symbols to check for divergences.
7. Option "show only the first letter" of the indicator replaced by: "show the abbreviation of the indicator".
Reason: the indicator abbreviation is more informative and easier to read.
8. Script converted to PineScript version 5.
█ CONCEPTS
Below I present a brief description of the available indicators.
1. Moving Average Convergence/Divergence (MACD):
Shows the difference between short-term and long-term exponential moving averages.
2. MACD Histogram:
Shows the difference between MACD and its signal line.
3. Relative Strength Index (RSI):
Measures the relative strength of recent price gains to recent price losses of an asset.
4. Stochastic Oscillator (Stoch):
Compares the current price of an asset to its price range over a specified time period.
5. Stoch RSI:
Stochastic of RSI.
6. Commodity Channel Index (CCI):
Measures the relationship between an asset's current price and its moving average.
7. Momentum: Shows the difference between the current price and the price a few periods ago.
Shows the difference between the current price and the price of a certain period in the past.
8. Chaikin Money Flow (CMF):
A variation of A/D that takes into account the daily price variation and weighs trading volume accordingly. Accumulation/Distribution (A/D) identifies buying and selling pressure by tracking the flow of money into and out of an asset based on volume patterns.
9. On-Balance Volume (OBV):
Identify divergences between trading volume and an asset's price.
Sum of trading volume when the price rises and subtracts volume when the price falls.
10. Money Flow Index (MFI):
Measures volume pressure in a range of 0 to 100.
Calculates the ratio of volume when the price goes up and when the price goes down.
11. Volume Oscillator (VO):
Identify divergences between trading volume and an asset's price. Ratio of change of volume, from a fast period in relation to a long period.
12. Price-Volume Trend (PVT):
Identify the strength of an asset's price trend based on its trading volume. Cumulative change in price with volume factor. The PVT calculation is similar to the OBV calculation, but it takes into account the percentage price change multiplied by the current volume, plus the previous PVT value.
13. Ultimate Oscillator (UO):
Combines three different time periods to help identify possible reversal points.
14. Fisher Transform (FT):
Normalize prices into a Gaussian normal distribution.
15. Z-Score/T-Score: Shows the difference between the current price and the price a few periods ago. I is a statistical measurement that indicates how many standard deviations a data point is from the mean of a data set.
When to use t-score instead of z-score? When the sample size is small (length < 30).
Here, the use of z-score or t-score is chosen automatically based on the length parameter.
█ What to look for
The operation is simple. The script checks for divergences between the price and the selected indicators.
Now with the possibility of using multiple symbols, it is possible to check divergences between different assets.
A well-described view on divergences can be found in this cheat sheet:
◈ Examples with SPY ETF versus indicators:
1. Regular bullish divergence with external indicator:
1. Regular bearish divergence with Fisher Transform:
1. Positive hidden divergence with Momentum indicator:
1. Negative hidden divergence with RSI:
◈ Examples with SPY ETF versus other symbols:
1. Regular bearish divergence with European Stoch Market:
2. Regular bearish divergence with DXY inverted:
3. Regular bullish divergence with Taiwan Dollar:
4. Regular bearish divergence with US10Y (10-Year US Treasury Note):
5. Regular bullish divergence with QQQ ETF (Nasdaq 100):
6. Regular bullish divergence with ARKK ETF (ARK Innovation):
7.Positive hidden divergence with RSP ETF (S&P 500 Equal Weight):
8. Negative hidden divergence with EWZ ETF (Brazil):
◈ Examples with BTCUSD versus other symbols:
1. Regular bearish divergence with BTCUSDLONGS from Bitfinex:
2. Regular bearish divergence with BLOK ETF (Amplify Transformational Data Sharing):
3. Negative hidden divergence with NATGAS (Natural Gas):
4. Positive hidden divergence with TOTALDEFI (Total DeFi Market Cap):
█ Conclusion
The symbols available to check divergences were chosen in such a way as to cover the main markets, in the most generic way possible.
You can adjust them according to your needs.
A trader in the American market, for example, could add more ETFs, American stocks, and sectoral indices, such as the XLF (Financial Select Sector SPDR Fund), the XLK (Technology Select Sector SPDR), etc.
On the other hand, a cryptocurrency trader could add more currency pairs and sector indicators, such as BTCUSDSHORTS (Bitfinex), USDT.D (Tether Dominance), etc.
If the chart becomes too cluttered, you can use the option to show only the number of divergences or only the indicator abbreviations.
Or even disable certain indicators and symbols, if they are not of interest to you.
I hope this script is useful.
Don't forget to support LonesomeTheBlue's work too.
Volume ValueWhen VelocityTitle: Volume ValueWhen Velocity Trading Strategy
▶ Introduction:
The " Volume ValueWhen Velocity " trading strategy is designed to generate long position signals based on various technical conditions, including volume thresholds, RSI (Relative Strength Index), and price action relative to the Simple Moving Average (SMA). The strategy aims to identify potential buy opportunities when specific criteria are met, helping traders capitalize on potential bullish movements.
▶ How to use and conditions
★ Important : Only on Spot Binance BINANCE:BTCUSDT
Name: Volume ValueWhen Velocity
Operating mode: Long on Spot BINANCE BINANCE:BTCUSDT
Timeframe: Only one hour
Market: Crypto
currency: Bitcoin only
Signal type: Medium or short term
Entry: All sections in the Technical Indicators and Conditions section must be saved to enter (This is explained below)
Exit: Based on loss limit and profit limit It is removed in the settings section
Backtesting:
⁃ Exchange: BINANCE BINANCE:BTCUSDT
⁃ Pair: BTCUSDT
⁃ Timeframe:1h
⁃ Fee: 0.1%
- Initial Capital: 1,000 USDT
- Position sizing: 500 usdt
-Trading Range: 2022-07-01 11:30 ___ 2023-07-21 14:30
▶ Strategy Settings and Parameters:
1. `strategy(title='Volume ValueWhen Velocity', ...`: Sets the strategy title, initial capital, default quantity type, default quantity value, commission value, and trading currency.
↬ Stop-Loss and Take-Profit Settings:
1. long_stoploss_value and long_stoploss_percentage : Define the stop-loss percentage for long positions.
2. long_takeprofit_value and long_takeprofit_percentage : Define the take-profit percentage for long positions.
↬ ValueWhen Occurrence Parameters:
1. occurrence_ValueWhen_1 and occurrence_ValueWhen_2 : Control the occurrences of value events.
2. `distance_value`: Specifies the minimum distance between occurrences of ValueWhen 1 and ValueWhen 2.
↬ RSI Settings:
1. rsi_over_sold and rsi_length : Define the oversold level and RSI length for RSI calculations.
↬ Volume Thresholds:
1. volume_threshold1 , volume_threshold2 , and volume_threshold3 : Set the volume thresholds for multiple volume conditions.
↬ ATR (Average True Range) Settings:
1. atr_small and atr_big : Specify the periods used to calculate the Average True Range.
▶ Date Range for Back-Testing:
1. start_date, end_date, start_month, end_month, start_year, and end_year : Define the date range for back-testing the strategy.
▶ Technical Indicators and Conditions:
1. rsi: Calculates the Relative Strength Index (RSI) based on the defined RSI length and the closing prices.
2. was_over_sold: Checks if the RSI was oversold in the last 10 bars.
3. getVolume and getVolume2 : Custom functions to retrieve volume data for specific bars.
4. firstCandleColor : Evaluates the color of the first candle based on different timeframes.
5. sma : Calculates the Simple Moving Average (SMA) of the closing price over 13 periods.
6. numCandles : Counts the number of candles since the close price crossed above the SMA.
7. atr1 : Checks if the ATR_small is less than ATR_big for the specified security and timeframe.
8. prevClose, prevCloseBarsAgo, and prevCloseChange : ValueWhen functions to calculate the change in the close price between specific occurrences.
9. atrval: A condition based on the ATR_value3.
▶ Buy Signal Condition:
Condition: A combination of multiple volume conditions.
buy_signal: The final buy signal condition that considers various technical conditions and their interactions.
▶ Long Strategy Execution:
1. The strategy will enter a long position (buy) when the buy_signal condition is met and within the specified date range.
2. A stop-loss and take-profit will be set for the long position to manage risk and potential profits.
▶ Conclusion:
The " Volume ValueWhen Velocity " trading strategy is designed to identify long position opportunities based on a combination of volume conditions, RSI, and price action. The strategy aims to capitalize on potential bullish movements and utilizes a stop-loss and take-profit mechanism to manage risk and optimize potential returns. Traders can use this strategy as a starting point for their own trading systems or further customize it to suit their preferences and risk appetite. It is crucial to thoroughly back-test and validate any trading strategy before deploying it in live markets.
↯ Disclaimer:
Risk Management is crucial, so adjust stop loss to your comfort level. A tight stop loss can help minimise potential losses. Use at your own risk.
How you or we can improve? Source code is open so share your ideas!
Leave a comment and smash the boost button!

RSI Signal Pro[UgurTash]Introducing RSI Signal Pro for TradingView
RSI Signal Pro is a refined version of the standard Relative Strength Index (RSI) , designed to improve signal accuracy by generating alerts in real-time instead of waiting for multiple candle confirmations. This enhancement allows traders to react faster to market movements while maintaining the familiar RSI structure.
What Makes RSI Signal Pro Unique?
✅ Real-Time RSI Signals: Unlike the traditional RSI, which waits for candle confirmations, this version provides immediate buy and sell signals upon key level crossovers.
✅ Dual Trading Modes: Choose between Simple Mode (standard RSI crossovers) and Advanced Mode (momentum-adjusted signals with price validation).
✅ Customizable RSI-Based Moving Average (MA): Optionally apply SMA, EMA, WMA, or VWMA to smooth RSI fluctuations and identify longer-term trends.
✅ Adaptive Signal Filtering: The Advanced Mode reduces false signals by filtering RSI movements with a momentum threshold and historical RSI validation.
✅ User-Friendly Interface: Simple ON/OFF toggles allow easy customization of the indicator's behavior.
How This Indicator Works
🔹 Simple Mode: Identical to traditional RSI, triggering signals when RSI crosses 30 (bullish) or 70 (bearish).
🔹 Advanced Mode: Uses historical RSI pivots, momentum verification, and price confirmation to refine signal accuracy—ideal for traders looking for more precise entries.
🔹 RSI-Based MA: Optionally overlay moving averages onto the RSI, providing additional trend confirmation.
How to Use RSI Signal Pro
1️⃣ Select a mode: Use Simple Mode for frequent alerts or Advanced Mode for refined signals.
2️⃣ Enable RSI-Based MA: Apply SMA, EMA, WMA, or VWMA to smooth RSI fluctuations.
3️⃣ Set alerts: TradingView notifications allow you to react to real-time RSI movements instantly.
4️⃣ Apply to multiple markets: Effective for crypto, forex, stocks, and commodities.
Why Use RSI Signal Pro Instead of Standard RSI?
While RSI Signal Pro maintains the core functionality of the standard RSI, its real-time signal generation allows traders to make faster decisions without the typical delay caused by waiting for candle confirmations. Additionally, the optional momentum filtering and moving average smoothing ensure fewer false signals and better trade accuracy.

Auto-Length Moving Average + Trend Signals (Zeiierman)█ Overview
The Auto-Length Moving Average + Trend Signals (Zeiierman) is an easy-to-use indicator designed to help traders dynamically adjust their moving average length based on market conditions. This tool adapts in real-time, expanding and contracting the moving average based on trend strength and momentum shifts.
The indicator smooths out price fluctuations by modifying its length while ensuring responsiveness to new trends. In addition to its adaptive length algorithm, it incorporates trend confirmation signals, helping traders identify potential trend reversals and continuations with greater confidence.
This indicator suits scalpers, swing traders, and trend-following investors who want a self-adjusting moving average that adapts to volatility, momentum, and price action dynamics.
█ How It Works
⚪ Dynamic Moving Average Length
The core feature of this indicator is its ability to automatically adjust the length of the moving average based on trend persistence and market conditions:
Expands in strong trends to reduce noise.
Contracts in choppy or reversing markets for faster reaction.
This allows for a more accurate moving average that aligns with current price dynamics.
⚪ Trend Confirmation & Signals
The indicator includes built-in trend detection logic, classifying trends based on market structure. It evaluates trend strength based on consecutive bars and smooths out transitions between bullish, bearish, and neutral conditions.
Uptrend: Price is persistently above the adjusted moving average.
Downtrend: Price remains below the adjusted moving average.
Neutral: Price fluctuates around the moving average, indicating possible consolidation.
⚪ Adaptive Trend Smoothing
A smoothing factor is applied to enhance trend readability while minimizing excessive lag. This balances reactivity with stability, making it easier to follow longer-term trends while avoiding false signals.
█ How to Use
⚪ Trend Identification
Bullish Trend: The indicator confirms an uptrend when the price consistently stays above the dynamically adjusted moving average.
Bearish Trend: A downtrend is recognized when the price remains below the moving average.
⚪ Trade Entry & Exit
Enter long when the dynamic moving average is green and a trend signal occurs. Exit when the price crosses below the dynamic moving average.
Enter short when the dynamic moving average is red and a trend signal occurs. Exit when the price crosses above the dynamic moving average.
█ Slope-Based Reset
This mode resets the trend counter when the moving average slope changes direction.
⚪ Interpretation & Insights
Best for trend-following traders who want to filter out noise and only reset when a clear shift in momentum occurs.
Higher slope length (N): More stable trends, fewer resets.
Lower slope length (N): More reactive to small price swings, frequent resets.
Useful in swing trading to track significant trend reversals.
█ RSI-Based Reset
The counter resets when the Relative Strength Index (RSI) crosses predefined overbought or oversold levels.
⚪ Interpretation & Insights
Best for reversal traders who look for extreme overbought/oversold conditions.
High RSI threshold (e.g., 80/20): Fewer resets, only extreme conditions trigger adjustments.
Lower RSI threshold (e.g., 60/40): More frequent resets, detecting smaller corrections.
Great for detecting exhaustion in trends before potential reversals.
█ Volume-Based Reset
A reset occurs when current volume significantly exceeds its moving average, signaling a shift in market participation.
⚪ Interpretation & Insights
Best for traders who follow institutional activity (high volume often means large players are active).
Higher volume SMA length: More stable trends, only resets on massive volume spikes.
Lower volume SMA length: More reactive to short-term volume shifts.
Useful in identifying breakout conditions and trend acceleration points.
█ Bollinger Band-Based Reset
A reset occurs when price closes above the upper Bollinger Band or below the lower Bollinger Band, signaling potential overextension.
⚪ Interpretation & Insights
Best for traders looking for volatility-based trend shifts.
Higher Bollinger Band multiplier (k = 2.5+): Captures only major price extremes.
Lower Bollinger Band multiplier (k = 1.5): Resets on moderate volatility changes.
Useful for detecting overextensions in strong trends before potential retracements.
█ MACD-Based Reset
A reset occurs when the MACD line crosses the signal line, indicating a momentum shift.
⚪ Interpretation & Insights
Best for momentum traders looking for trend continuation vs. exhaustion signals.
Longer MACD lengths (260, 120, 90): Captures major trend shifts.
Shorter MACD lengths (10, 5, 3): Reacts quickly to momentum changes.
Useful for detecting strong divergences and market shifts.
█ Stochastic-Based Reset
A reset occurs when Stochastic %K crosses overbought or oversold levels.
⚪ Interpretation & Insights
Best for short-term traders looking for fast momentum shifts.
Longer Stochastic length: Filters out false signals.
Shorter Stochastic length: Captures quick intraday shifts.
█ CCI-Based Reset
A reset occurs when the Commodity Channel Index (CCI) crosses predefined overbought or oversold levels. The CCI measures the price deviation from its statistical mean, making it a useful tool for detecting overextensions in price action.
⚪ Interpretation & Insights
Best for cycle traders who aim to identify overextended price deviations in trending or ranging markets.
Higher CCI threshold (e.g., ±200): Detects extreme overbought/oversold conditions before reversals.
Lower CCI threshold (e.g., ±10): More sensitive to trend shifts, useful for early signal detection.
Ideal for detecting momentum shifts before price reverts to its mean or continues trending strongly.
█ Momentum-Based Reset
A reset occurs when Momentum (Rate of Change) crosses zero, indicating a potential shift in price direction.
⚪ Interpretation & Insights
Best for trend-following traders who want to track acceleration vs. deceleration.
Higher momentum length: Captures longer-term shifts.
Lower momentum length: More responsive to short-term trend changes.
█ How to Interpret the Trend Strength Table
The Trend Strength Table provides valuable insights into the current market conditions by tracking how the dynamic moving average is adjusting based on trend persistence. Each metric in the table plays a role in understanding the strength, longevity, and stability of a trend.
⚪ Counter Value
Represents the current length of trend persistence before a reset occurs.
The higher the counter, the longer the current trend has been in place without resetting.
When this value reaches the Counter Break Threshold, the moving average resets and contracts to become more reactive.
Example:
A low counter value (e.g., 10) suggests a recent trend reset, meaning the market might be changing directions frequently.
A high counter value (e.g., 495) means the trend has been ongoing for a long time, indicating strong trend persistence.
⚪ Trend Strength
Measures how strong the current trend is based on the trend confirmation logic.
Higher values indicate stronger trends, while lower values suggest weaker trends or consolidations.
This value is dynamic and updates based on price action.
Example:
Trend Strength of 760 → Indicates a high-confidence trend.
Trend Strength of 50 → Suggests weak price action, possibly a choppy market.
⚪ Highest Trend Score
Tracks the strongest trend score recorded during the session.
Helps traders identify the most dominant trend observed in the timeframe.
This metric is useful for analyzing historical trend strength and comparing it with current conditions.
Example:
Highest Trend Score = 760 → Suggests that at some point, there was a strong trend in play.
If the current trend strength is much lower than this value, it could indicate trend exhaustion.
⚪ Average Trend Score
This is a rolling average of trend strength across the session.
Provides a bigger picture of how the trend strength fluctuates over time.
If the average trend score is high, the market has had persistent trends.
If it's low, the market may have been choppy or sideways.
Example:
Average Trend Score of 147 vs. Current Trend Strength of 760 → Indicates that the current trend is significantly stronger than the historical average, meaning a breakout might be occurring.
Average Trend Score of 700+ → Suggests a strong trending market overall.
█ Settings
⚪ Dynamic MA Controls
Base MA Length – Sets the starting length of the moving average before dynamic adjustments.
Max Dynamic Length – Defines the upper limit for how much the moving average can expand.
Trend Confirmation Length – The number of bars required to validate an uptrend or downtrend.
⚪ Reset & Adaptive Conditions
Reset Condition Type – Choose what triggers the moving average reset (Slope, RSI, Volume, MACD, etc.).
Trend Smoothing Factor – Adjusts how smoothly the moving average responds to price changes.
-----------------
Disclaimer
The content provided in my scripts, indicators, ideas, algorithms, and systems is for educational and informational purposes only. It does not constitute financial advice, investment recommendations, or a solicitation to buy or sell any financial instruments. I will not accept liability for any loss or damage, including without limitation any loss of profit, which may arise directly or indirectly from the use of or reliance on such information.
All investments involve risk, and the past performance of a security, industry, sector, market, financial product, trading strategy, backtest, or individual's trading does not guarantee future results or returns. Investors are fully responsible for any investment decisions they make. Such decisions should be based solely on an evaluation of their financial circumstances, investment objectives, risk tolerance, and liquidity needs.
